|
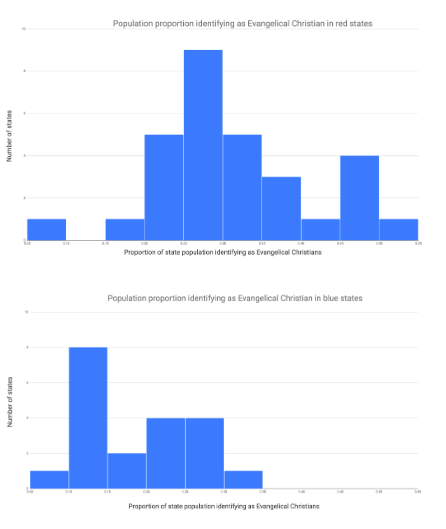
Project Overview: Each student first reflects upon their own social identities. They then choose a social identity group of which they are not a member that they would like to understand more fully through both reading and statistical analysis. They read an article and gather values of a quantitative variable related to the chosen social identity group for each state. Students ultimately construct two histograms to display the distribution of the variable across two different groupings of states.
Student Reflections:
Comments are closed.
|
AuthorsThe content showcased here is very much the work of a large, diverse group of BHS teachers. Categories
All
Archives
March 2020
|
 RSS Feed
